For the past 6-7 months I’ve been learning Unreal Engine 4 after having used mostly Unity for the past couple of years. As part of that learning I’ve been doing 1 game jam per month, which has been tremendous for the learning process and my growth as a game programmer.
But as most of us know, game jams are rushed and it’s easy to develop bad habits. In addition, Unreal by default can be very performance-heavy, requiring the developer to have a strong knowledge of the engine in order to properly rein it in. Most of my games came out simple as intended, but I would get the occasional comment saying the person could not play my game due to GPU requirements.
Because of this, I’ve focused the past ~2 months on learning how to optimize games in UE4 (and in general) with the intent of going back and improving the performance of my game jam entries. I plan on going through several others in the future. I wanted to write a little bit about how this went and what I learned in case I can help anyone else learn from what I learned. I’m definitely still not an expert so don’t be surprised if some of this stuff is basic but here it goes.
The Goal
- Try to get First Rock from the Sun running at 60 FPS on my 10+ year old laptop:
- CPU: Intel Core i5 M460 (dual-core 2.53GHz)
- GPU: AMD Mobility Radeon HD 5000 Series
- 4 GB RAM
- Profile using the tools UE4 provides, identify problems, and take pictures to show improvement later
- Target these problem areas with fixes, make the fix, profile again to prove the optimization did/didn’t work
Most of my images here will be from Unreal Insights and the stat commands inside of the engine so it helps to know a little about them but it’s not super necessary.
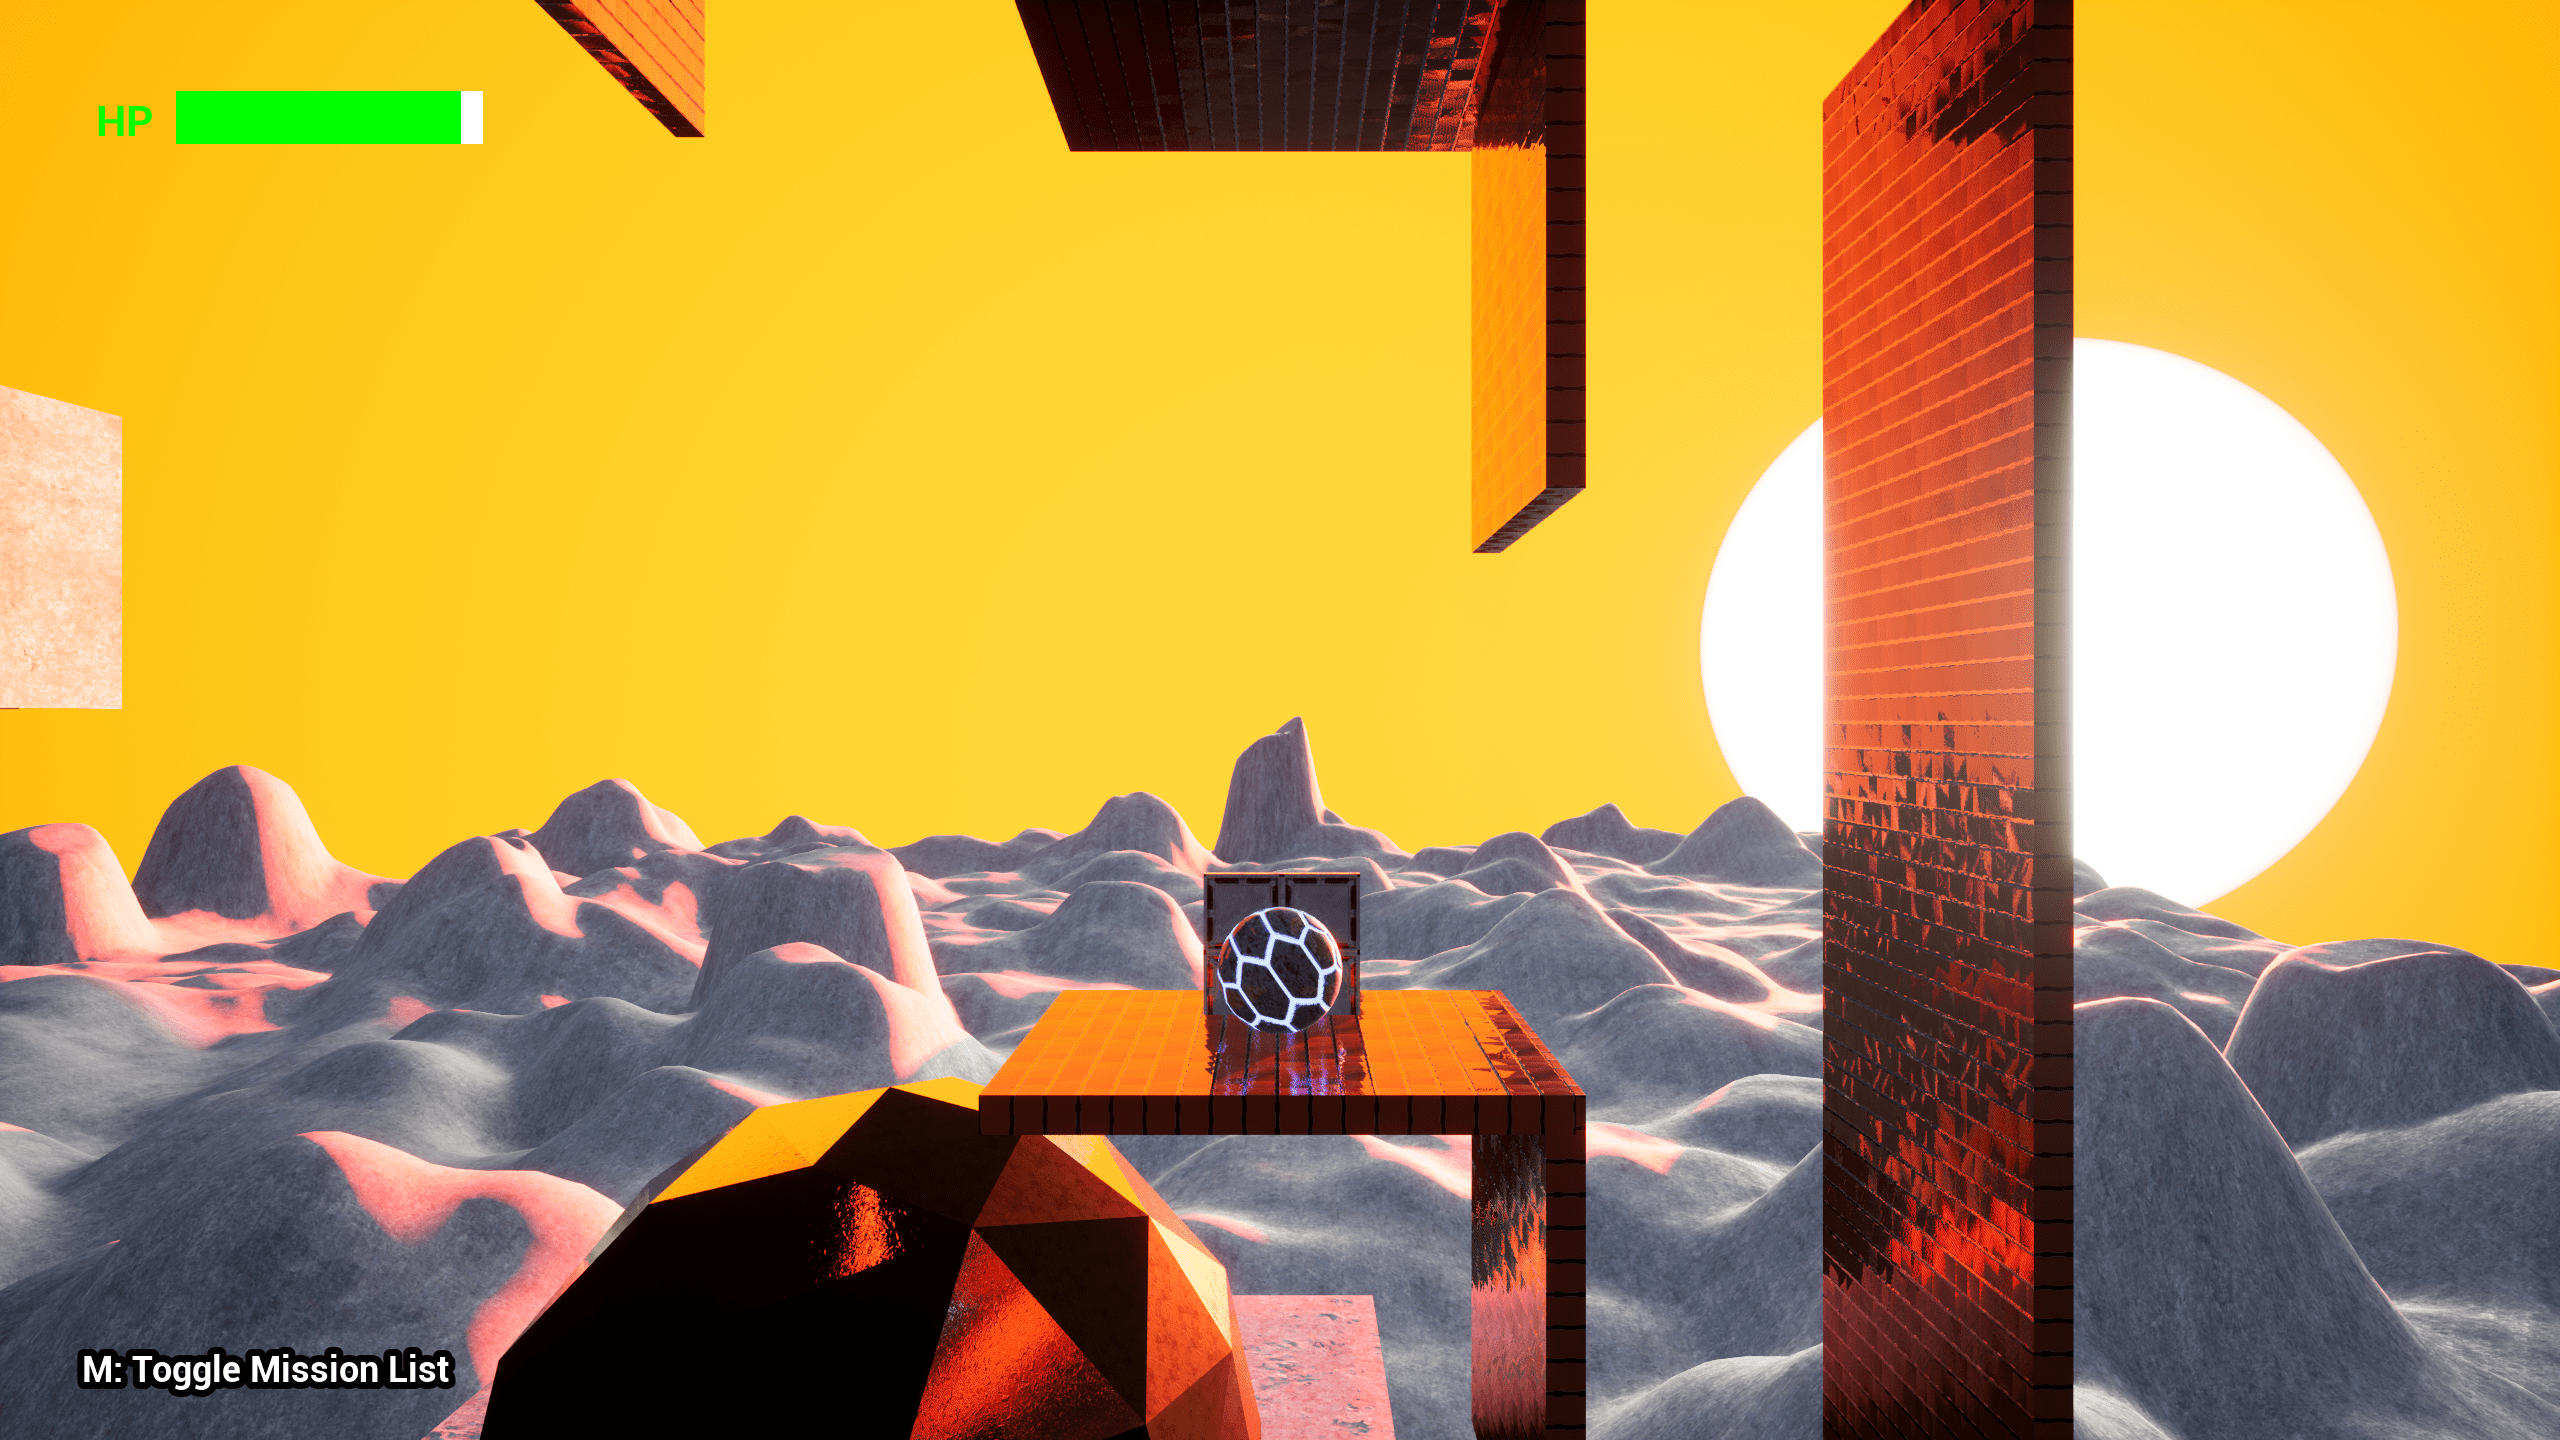
If you haven’t seen or played First Rock from the Sun, you can do so here to get some basic background on how the game works.
A Note About Images
Just wanted to mention some things about the images I’ll be posting. Almost all of these images are will be from the Unreal Insights tool and usually just of the Frames Panel and the Timing Panel. I just did this to keep it simple and readable and so I wasn’t posting the entire window every time. You can learn more about Unreal Insights here: Unreal Insights Overview
One final note is that you will see in my Frames Panel a section of very low millisecond frames followed by a jump in frame times. This is due to the game opening on a Main Menu with just a static image (nothing to render) and then loading the actual Gameplay level. That beginning section can be ignored as I’ll be focused on the performance of the Gameplay level. In addition there will always be a spike at the very end of the Frames Panel where I Ctrl+Esc in order to manually close out the window. That can be ignored as well.
Initial Profiling & Analysis
Before you can start optimizing you must understand where the bottlenecks are or you risk wasting your time optimizing something that will have little impact increasing your milliseconds per frame. So that’s where and I started. Here are the results:
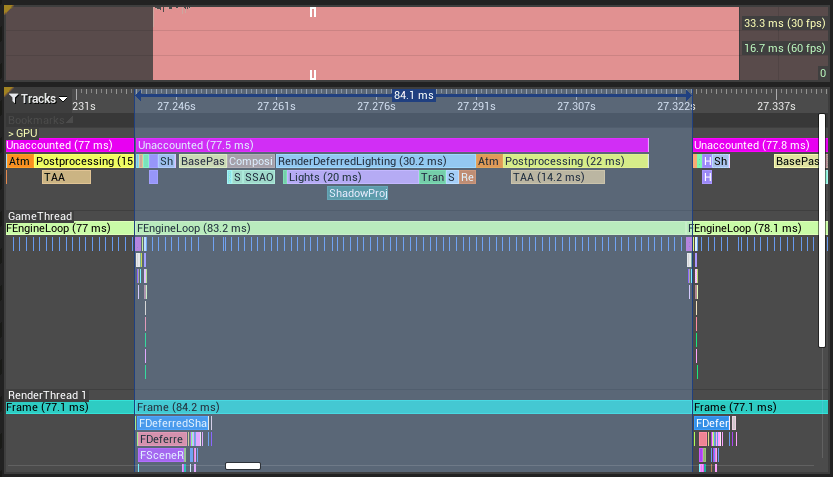
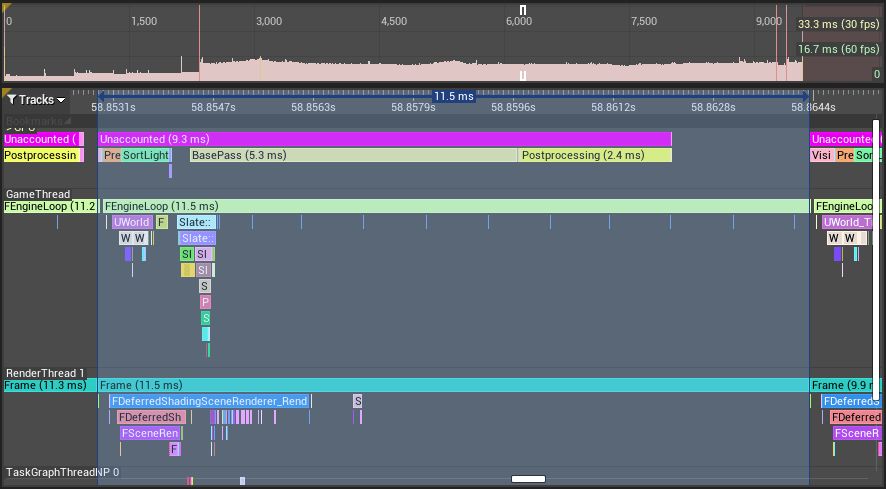
If you’ve never seen Unreal Insights before, it’s a profiling tool used to record a play session and allow you to breakdown individual frames to see what’s taking the most time. The top part is a bar graph, with a bar for each frame, showing you cut off points for 30 and 60FPS. Here you can see the bars have gone all the way up past 30 FPS meaning the game is running lower that 30 FPS. And the bottom section shows you all the components that make up a single frame and how long each of them took. If you selected a frame at the top then the bottom will highlight in blue the components that made up that frame. So the frame I selected in this picture took 84.1ms and we can see breakdown of that frame at the bottom.
This is really bad performance obviously, we’re running sub 30 FPS and can see clearly we are GPU-bound (the GPU is bottleneck). At this point I started to wonder if my laptop was just too weak to run an Unreal game. I obviously wasn’t going to get a good profiling test without lowering the settings a bit, so the first thing I looked into was quality settings.
Run Hardware Benchmark
I spent some time looking into how to lower Unreal’s overall quality settings. I created a very quick and basic Options menu in my game that only included 2 options: Graphics Quality and Render Resolution. This helped a bit but didn’t really solve the overall problem. But then I discovered the Run Hardware Benchmark node:
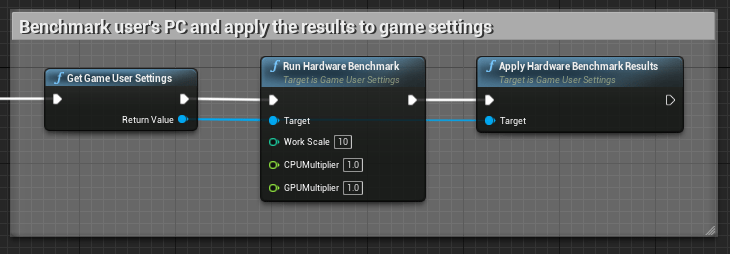
Run Hardware Benchmark and Apply Hardware Benchmark Results will run a benchmark on the user’s PC, determine the optimal settings based on this benchmark, and apply those to the engine automatically. I’ll be honest when I started using this I didn’t quite understand what it was doing (what it was actually changing about the engine). And it wasn’t until later that I started printing out a log showing the changes its made. I’ll show these results a little later. Here’s the affect it had on performance:
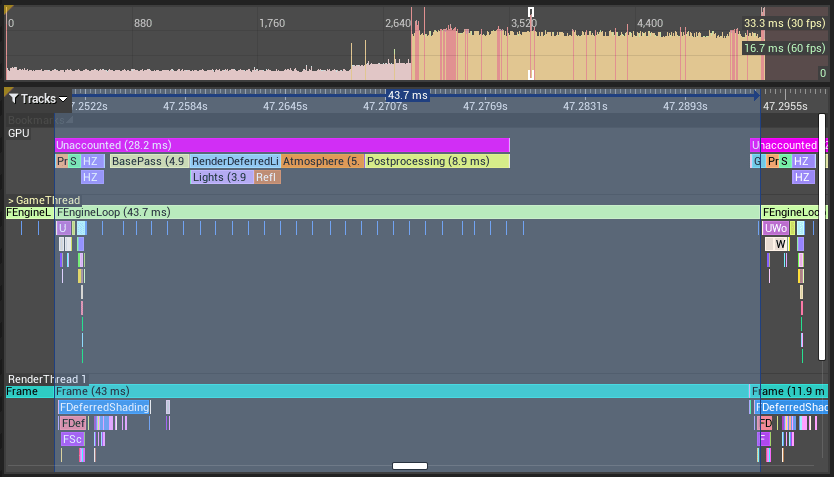
Pretty good improvement but as you can see below it did turn quite a few things way down. We’ve gone from a consistent sub-33ms to an average of 33ms (30 FPS). You can tell by how many bars are colored red, those are the frames that jump below 33ms (30 FPS). According to the logs I printed, basically everything:
- Resolution Scale: 100% -> 50%
- View Distance Quality: 3 -> 0
- Anti-Aliasing Quality: 3 -> 0
- Post Processing Quality: 3 ->0
- Shadow Quality: 3 -> 0
- Texture Quality: 3 -> 0
- Visual Effect Quality: 3 -> 0
- Foliage Quality: 3 -> 0
For context, 3 is “Epic” and 0 is “Low”. So it’s definitely the case that my laptop is weak but this did actually get the game running in a state where I can slowly start to improve things. From here on I keep most of these settings except Resolution Scale, which I keep at 100, just because I don’t really ever want to play a game at lower than native resolution.
Post-Processing
My next attempt wasn’t as fruitful as the first. Running off that last image I sent, the biggest time sink was Post-Processing and it seemed to jump around a lot. Some frames it would only take 2.4ms, followed by 9.8ms, then 5.6ms, etc. So I definitely wanted to calm that down a bit.
I noticed that by default, under Project Settings > Engine – Rendering > Default Settings, Unreal enables Motion Blur, Ambient Occlusion, and Bloom. I had not turned any additional settings on so this was effectively all of the post-processing in my scene. I ended up turning all of this off and instead using a Post Process Volume in the scene in order to more explicitly control these values.
Next, I went through and tweaked some of the values (mainly turned them down) to see what I felt was necessary and wasn’t. My game features a giant sun that changes in intensity, so Bloom was necessary in my opinion, but everything else I completely shut off. I was hoping this would cause a good down-spike in Post-Processing but it didn’t quite have as good of an effect as I thought:
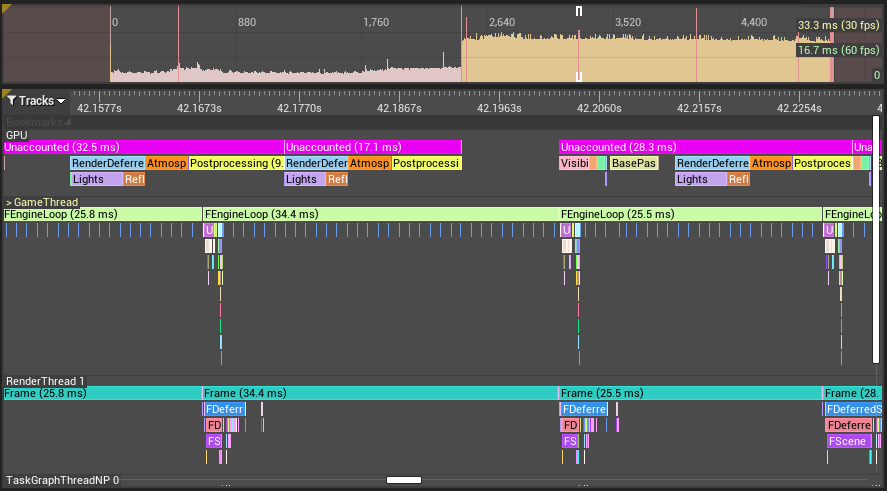
Above we can see a Postprocessing cycle of 9.7ms, followed by 6.7ms, then 5.7ms. So it doesn’t seem like it actually drove down the cost. Using the Unreal Insights tool I couldn’t tell if the average Post-Processing ms went down or not either. However comparing this image with the previous, we can clearly see in the upper window that we are now staying above 30 FPS more often (there are less red bars) so it does appear that there was some gain.
My hypothesis here is because of the benchmark tool in the previous section, my Post-Processing quality is set to Low. Which would mean that any potential gains in Post-Processing would be minimal since its already turned down quite a bit. So perhaps these changes did have some slight effect on the average post-processing frame timing but not a huge one.
Atmosphere
Another decent time sink was the Atmosphere pass. You can see this in the above image and the previous one as well. Atmosphere never dipped below 5.4ms and sometimes shot up to 8-11ms. My game takes place in space so the sky is black with very little atmospheric effects. However there was an Atmospheric Fog actor in the scene by default so I checked there first.
First some backstory on how my game works. I am using a Directional Light with a BP_SkySphere that I override to expose some variables. My game features a mechanic where occasionally the sky will turn red indicating to the player that they must hide from the sun or get burned. In order to achieve this effect I thought I needed the use of an Atmospheric Fog actor.
Atmospheric Fog adds some elements to the skybox in order to make it look like there’s an atmosphere. It links up with the Directional Light in the scene and colors the skybox based on its properties. When one of these solar flares activates, I simply change the Directional Light’s color and intensity and in turn the Atmospheric Fog changes the color of the sky to match. I originally thought this was the way it had to be done, but during this optimization I decided to experiment to see if I could eliminate it.
I discovered I could instead use Zenith Color and Horizon Color directly on the BP_SkySphere to manually control the sky color and completely get rid of the Atmospheric Fog:
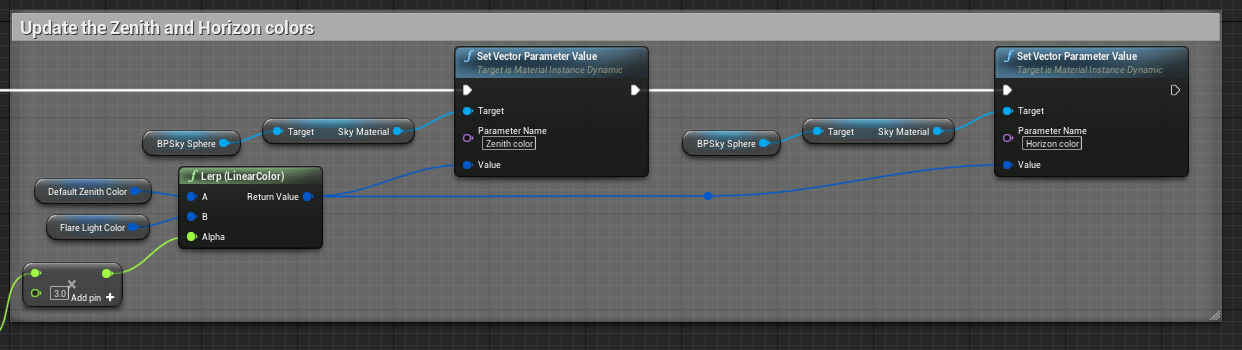
Using Set Vector Parameter Value, you can directly set Zenith and Horizon color, which is what’s happening in the above image via a Lerp. Using this I could delete the Atmospheric Fog from the scene and save those 5-11ms per frame:

You can see in the above image that the Atmosphere pass is missing from the lower window meaning we no longer have that 5-11ms every single frame. So a big improvement with virtually no downgrade in functionality. At this point there are basically no spikes above 30 FPS outside a spike when the game level is loaded up and another when I pause/minimize the window in order to close it. With that update, the game is running at an average of 22ms/frame or about 45 FPS.
Reducing Tick
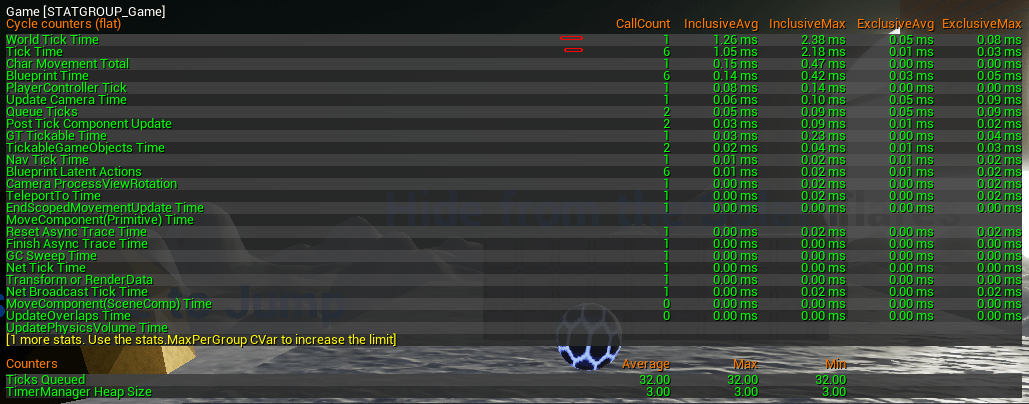
Tick is like the Update() function in Unity, it’s called every single frame. As such its very convenient to throw some code in there and call it a day. This was my first game developed using Unreal (outside of tutorials) and as such I didn’t know how to use Tick in an efficient way. But when I returned for this optimization pass I was more experienced, so I knew going into it there were a few Ticks I could eliminate. This game is pretty simple so there wasn’t a lot of Tick abuses but here’s what the dumpticks command showed:

I know this isn’t great to read but this is the dumpticks command output, listing each actor that is ticking. Combing through this my main points of issue are the BP_GJGameMode tick (highlighted in the image on line 17), the HUD tick (line 26), the GameMap tick (line 28), and the BP_MainCharacter tick on line 30. These are ticks that I coded into the system, I could probably eliminate or reduce all 3 of these. To keep this post from being 10 pages long I’m only going to write about the quick ones in the next few sections.
Removing Tick – HUD
First I started with WBP_HUD because this one was doing several things on Tick I felt could be eliminated easily with an event-based approach:

Each of these 3 functions running on Tick are all just checking the value of a property in either the GameMode or the MainCharacter. So my fix was to expose these functions publicly, and then when either GameMode or MainCharacter updated one of these properties, ping the HUD that it changed. Then the HUD can perform its actions on one of these changes without needing to check for changes every single frame.
Removing Tick – Main Character


Here we were using Tick both in C++ and in Blueprints. This use was particularly egregious because the Blueprint Tick code was fixing a real non-issue. The GameMode was attempting to spawn the MainCharacter in the MainMenu level because the MainMenu was using the gameplay GameMode. This was causing some weird functionality so I created this code in order to fix that issue. This could easily be fixed by creating a new GameMode, with no player character set, and using that on the MainMenu level instead. So that’s what I did and it completely eliminated the need for the above Blueprint code.
As for the C++ side, I had a harder time. In my game the ball rotates in the direction of your input (left or right) to make it appear as if it’s rolling. I wasn’t sure of a great way to do this that didn’t involve Tick in some way. I did end up trying to move this code out using a Timer however it just didn’t feel as good. I ended up leaving this code here for now.
Removing Tick – GameMode
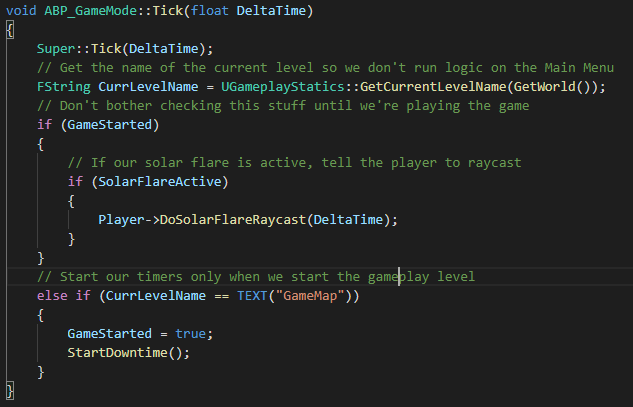
So this tick is responsible for 2 things: performing the Solar Flare raycast check to hurt the player while in the sun, and to start the game if we’re on the GameMap. That second if-statement can be deleted at this point with our changes in the last section. As for the solar flare raycast, this is responsible for performing a raycast when the Solar Flare is active that will ultimately hurt the player if they are not behind cover. Currently this is happening every single frame, but if we think about it, probably doesn’t need to happen every frame.
This game works in cycles. There’s a Downtime phase, which transitions to a Warning phase, and then to a Solar Flare phase. The Solar Flare is only active during the Solar Flare phase, therefore this tick is wasted time unless we’re in the Solar Flare phase. This is a great spot to use a timer instead of tick. With a timer we can start/stop it whenever we want (when Solar Flare phase stops/starts) and we can tell it to only fire after X amount of frames instead of every single frame.
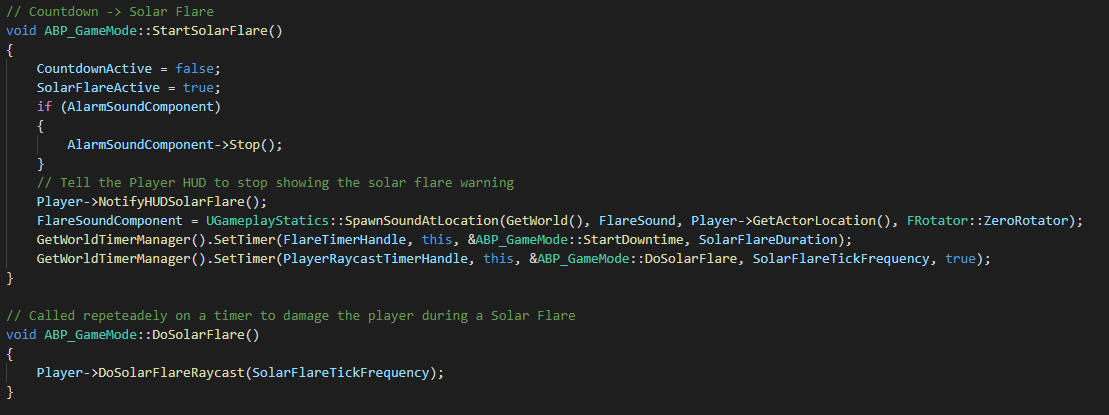
This might be harder to understand if you’re not familiar with C++ or Unreal. StartSolarFlare() is triggered whenever our Solar Flare phase begins. At the bottom we create a new timer using PlayerRaycastTimerHandle, telling it to call the DoSolarFlare() function every SolarFlareTickFrequency seconds. It’s not pictured here but the PlayerRaycastTimerHandle is cleared once the Downtime phase starts, meaning it will stop calling DoSolareFlare().
Removing Tick – Results

With all of the above changes, and some I didn’t mention (mainly about the Level Blueprint), here’s what our new dumpticks looks like. You’ll notice we eliminated HUD, GameMode, and GameMap. For reasons mentioned in an above section BP_MainCharacter is still here, however the workload has been reduced.
Hopefully these past few sections have given you some ideas on how to reduce Tick or any per-frame operations. Most of the time your operations don’t need to happen every single frame. Using an event-based approach can cut down on tick timings a lot. And in the case with Unreal, you can use timers to mimic activating/deactivating Ticks and better control how often they activate. I did not show it here but you can also reduce how often each blueprint ticks under Details > Actor Tick > Tick Interval.
Deferred vs. Forward Rendering
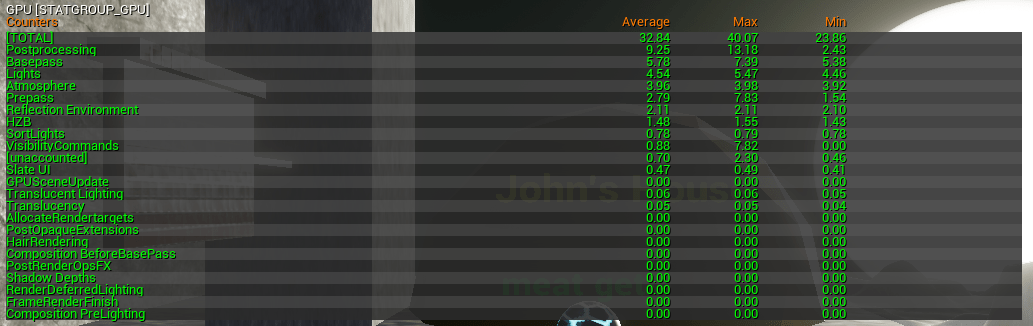
By default UE4 uses Deferred Rendering, but there is a Forward Shading checkbox under Project Settings > Rendering > Forward Renderer. Enabling that checkbox will enable Forward rendering instead of the default: Deferred. There are a lot of differences that I won’t go into but basically Forward Shading is a different way of handling lighting that gives us increased performance at the cost of less lighting features. Materials need to explicitly opt-in to some of these features if you want them, but for a small game jam entry like this, it shouldn’t be a problem. So I experimented with it a bit to see what kind of performance increase and visual downgrade I get.
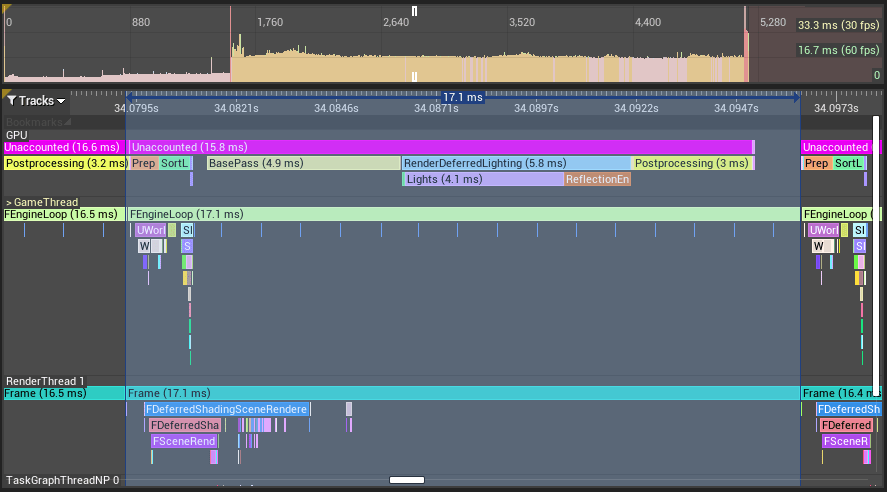
On the left is our current performance using default Deferred Rendering and on the right is Forward Rendering. As you can see this puts us underneath the 16.7ms (60 FPS) line so definitely a good increase in performance. We can also see the RenderDeferredLighting pass disappears and Basepass almost doubles. This is because Forward Rendering does all lighting work in the Basepass while Deferred handles it in a separate pass later (hence the name Deferred). Now for the visuals:

Once again the left is Deferred and the right is Forward. We can definitely see the most notable loss is in the reflections. This is explicitly stated in the Forward Shading checkbox so its expected. Honestly though, I don’t think it’s too bad of a downgrade. A small game jam entry like this doesn’t need crazy reflections and I rather prefer the shadow caused by the barrier in the right image because it more clearly shows where to hide from the sun. Harder to see is the slight change in lighting in the background landscape but its such a small difference its barely noticeable.
When considering this in your own project though there are other things you want to look at. For me when I’m strictly looking at performance and not so much visual quality it’s easy to pick Forward over Deferred. But for your own project you might want those better looking reflections, or maybe you have multiple light sources (which are more performant using Deferred). In addition, some of these features can be turned off on a per-material basis without entirely switching over to Forward Shading. I urge you to look into the differences for yourself so that you can understand and make a decision about what’s better for your game. At the end of the post I’ll have some links to resources that are helpful.
Landscape LODs

The picture above is the Quad Overdraw optimization view mode. The bar on the bottom indicates how much Quad Overdraw is in the scene, with dark blue on the left being no overdraw, while white on the right is a lot of overdraw. As you can see we have a decent amount of green in our scene which indicates a slight Quad Overdraw issue with the landscape.
Quad Overdraw is basically when the GPU needs to process a quad multiple times. GPUs process pixels in “quads” or 2×2 blocks of pixels – not singular pixels. When the GPU attempts to draw a triangle that only touches one pixel of a quad, it first processes the entire quad and then comes back again to throw out the other 3 unused pixels. Those unneeded pixels are wasted GPU time therefore cutting back on Quad Overdraw can increase our GPU efficiency.
I believe this is happening because I smoothed the landscape a bit much at the far end when creating it. As part of going through TechArtAid‘s videos I learned you can actually LOD sections of a landscape. You can either force them to be a specific LOD or give them an LOD Bias (start at a higher LOD than normal). In this case because the player never actually gets any closer or further to the landscape, I decided to just force it. I ended up forcing the closer ones to LOD 1, medium-ranged to LOD 2, and the last row of sections to LOD 3. Here is the result:

The reduction in green corresponds to a reduction in the amount of Quad Overdraw in the scene. By LOD-ing the landscape we are reducing the density of vertices. This means vertex triangles will be larger than previously, reducing visual quality of objects but results in less quad overdraw. Below is the visual before/after. We can see there is very little visual downgrade in the landscape:

Before 
After


Finally, our current performance from Unreal Insights indicates that we bought ourselves an extra 1-2ms on average when compared to the performance window above in the Deferred vs Forward section:

BSPs, Static Meshes, & Shadows
When gray-boxing out a level in Unreal its very convenient to use BSP Brushes. When I originally set up this game I used BSPs to lay out the entire and scale geometry quickly without the materials stretching. However there’s some things you can’t control when you use a BSP instead of a Static Mesh. In the case of this game, every BSP I put into the game is casting a shadow when you can’t necessarily see it. The only shadows I really need to generate are the ones casted by objects that the player can hide behind when avoiding the sun.
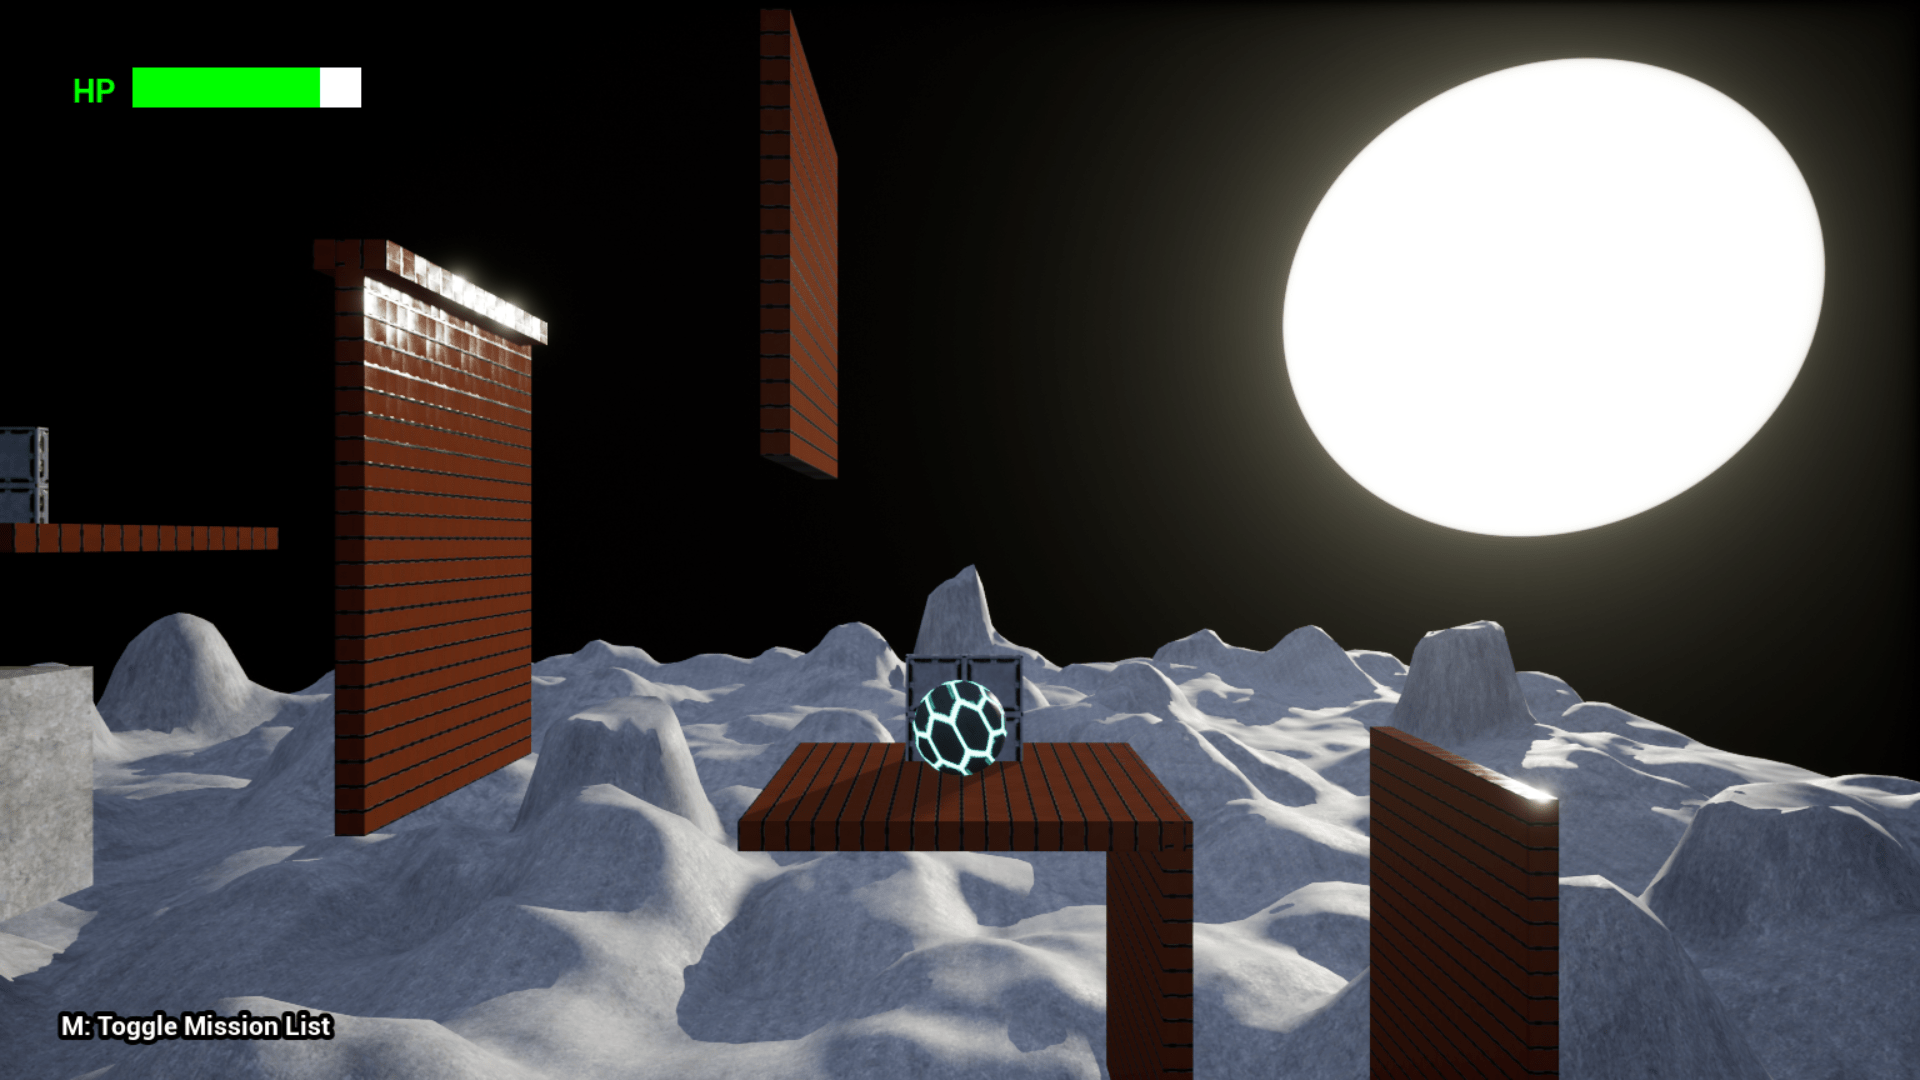
In the above picture, all of the objects that are highlighted are really the only ones I feel need shadows. The rest of the objects are casting shadows unnecessarily, in every case you can’t even see the shadow on-screen. That’s a good amount of wasted shadow calculations. Static Meshes allow you to turn shadow casting on/off per-object. However I built the level out using BSPs instead of Static Meshes. Fortunately Unreal has a quick way to transform a BSP into a Static Mesh, so I wanted to perform that on each object to better control how many shadows are being calculated. Once I went through that process I turned off shadow casting for all objects above that are NOT highlighted.
Here are the performance metrics after that:
Honestly, I couldn’t see a big improvement after this so I’m not sure it made that much of a difference. It didn’t hurt either though, and having less shadow casters in the scene is definitely a good thing. Especially since we’re using a Dynamic Light. This could be a similar case as the Post-Processing section: shadow quality was reduced to 0 by Run Hardware Benchmark and therefore doesn’t have a large impact on performance. But honestly I’m just speculating here. Good news is we are firmly running below the 60FPS line which was the goal of this entire venture.
Conclusion
I’ll be honest I didn’t think I would hit the mark I originally set. But I did it, I successfully made the game run at ~11.5ms (>60 FPS) on my 10+ year old laptop. I know this probably is not a huge feat but when you look at where I was when I started this process 2 months ago, this is a big improvement. Now for some quick before and after images.
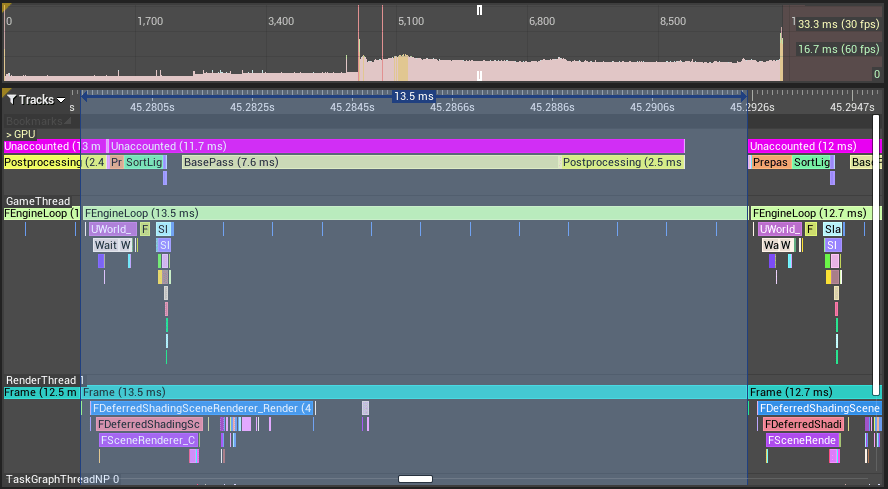
Above on the left is our very first Unreal Insights readout (84.1ms) and on the right is our last one (11.5ms). We can see our BasePass has increased, but RenderDeferredLighting (and everything underneath it) has been eliminated. Both of these are due to the switch from Deferred to Forward rendering. PostProcessing is also much smaller for several reasons: lowering of overall quality due to Run Hardware Benchmark and also a removing of Motion Blur and lowering of Bloom in the actual PostProcessing settings. In addition, Atmosphere pass has been eliminated due to the reworking of the lighting components of the scene and changes to the sun mechanic.
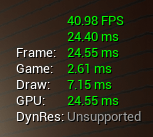
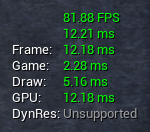
Here is the overall stat unit / stat fps output. Admittedly, the before picture is from after applying the Hardware Benchmark changes so its not quite as bad as our Unreal Insights image at the beginning of the blog post. We can see our GPU time has dropped from 24.55ms to 12.18ms. Since that was our bottleneck it has increased our Frame time equally as well. It is still our bottleneck, but we’ve decreased the frame time dramatically.

Before – Solar Flare 
After – Solar Flare 
Before – Normal 
After – Normal


Here are the visual before/after changes. Before is on the left while After is on the right. The top 2 images show the Solar Flare phase while the bottom 2 images show the Downtime phase. As we can see there’s definitely a visual loss, especially in reflections and lighting. Personally I don’t think it’s a huge visual downgrade for the performance gains. Most of this is from the switch from Deferred or Forward rendering and the changes I made to PostProcessing. I think in the future I’ll try and turn Deferred Rendering back on to see if I can make it look a little better but stay under 60 FPS but as of right now I haven’t tried.
I feel like I’m starting to understand how Unreal works under the hood and I definitely learned about graphics optimizations. I hope if you made it this far in the blog that you got something out of it. This is my first game dev blog post so I tried to do my best but I’m sure I messed some things up that I will improve upon in the future.
Resources & More Information
Of course I didn’t learn all of this by myself. I had to go through many blog posts and videos to figure some of this out, especially when it came to applying these concepts. Here are some links to resources that were the most helpful:
- A very comprehensive video series on GPU Profiling in UE4: TechArtAid
- A webpage blog going more in-depth with the above video: Unreal Art Optimization
- An overview of how GPUs perform (not UE4-related): GPU Performance for Game Artists
- Several videos of high-level optimization concepts in UE4: Dev Days 19, Dev Days 18, Dev Days 17
- Unreal Insights: Live Training and Overview
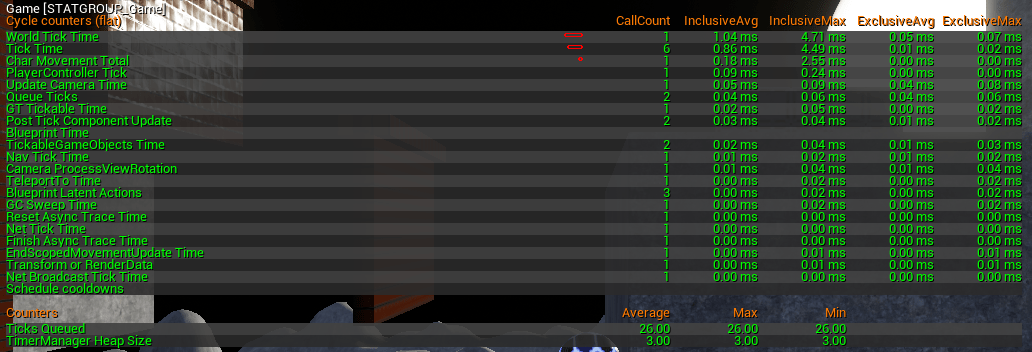
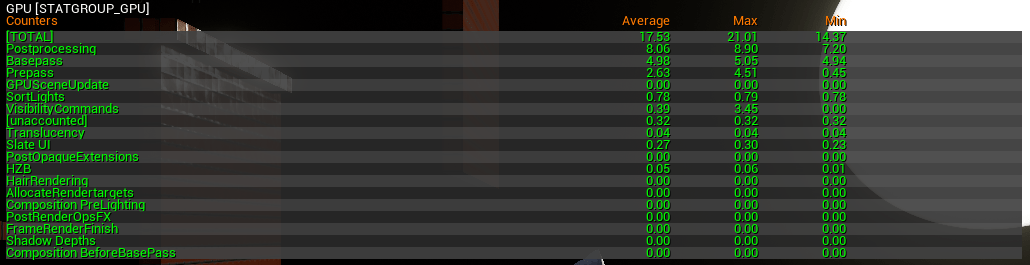
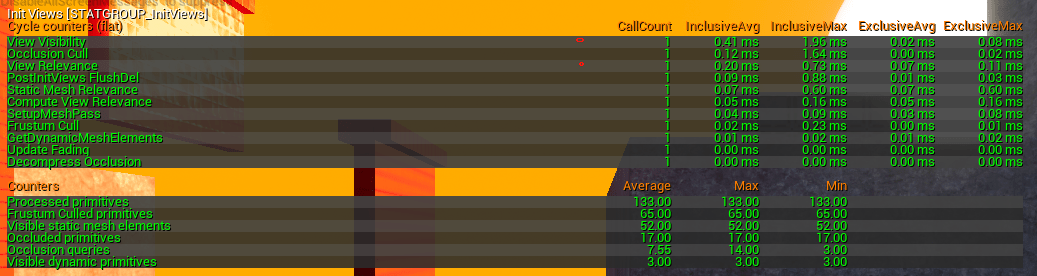
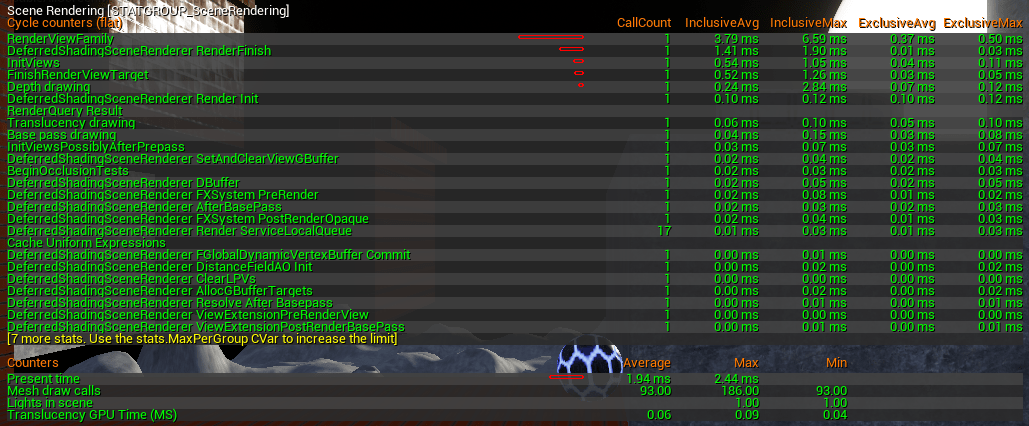
Finally several before and after pictures of various performance metrics. You’ll need to click to open the pics for the sake of space. First the before:

Then the after (NOTE: these were taken after the Run Hardware Benchmark phase):